Projects
A selection of my geospatial projects. Click any card to see the full write-up.
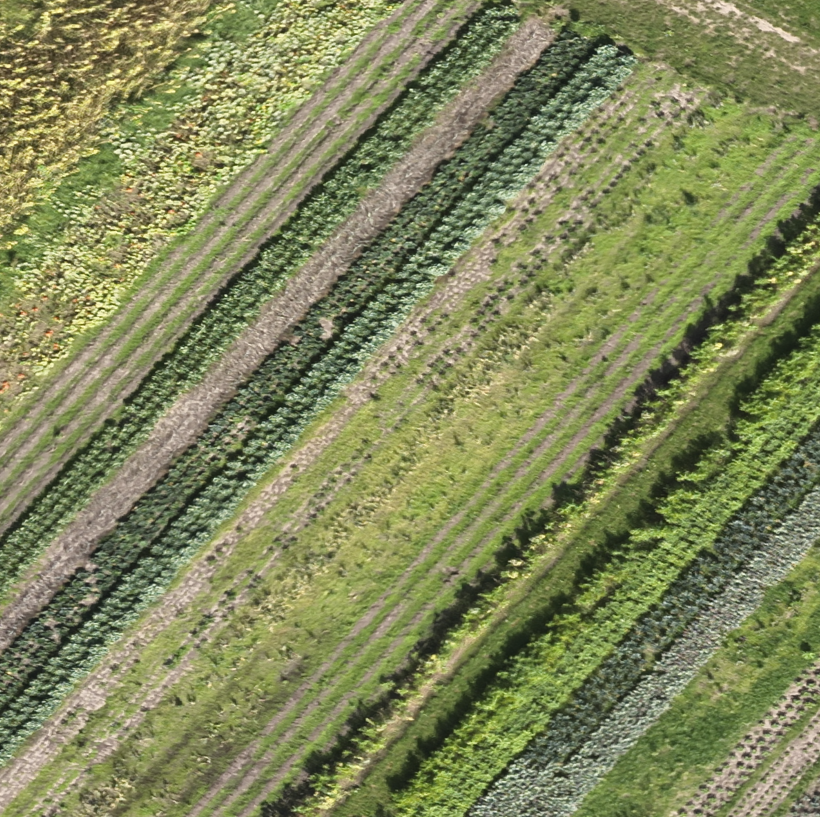
Drone-Based Crop Health Monitoring
Processed UAV imagery to assess crop health using vegetation indices and generate high-resolution orthomosaics for agricultural monitoring.
Python Pix4DMapper QGIS
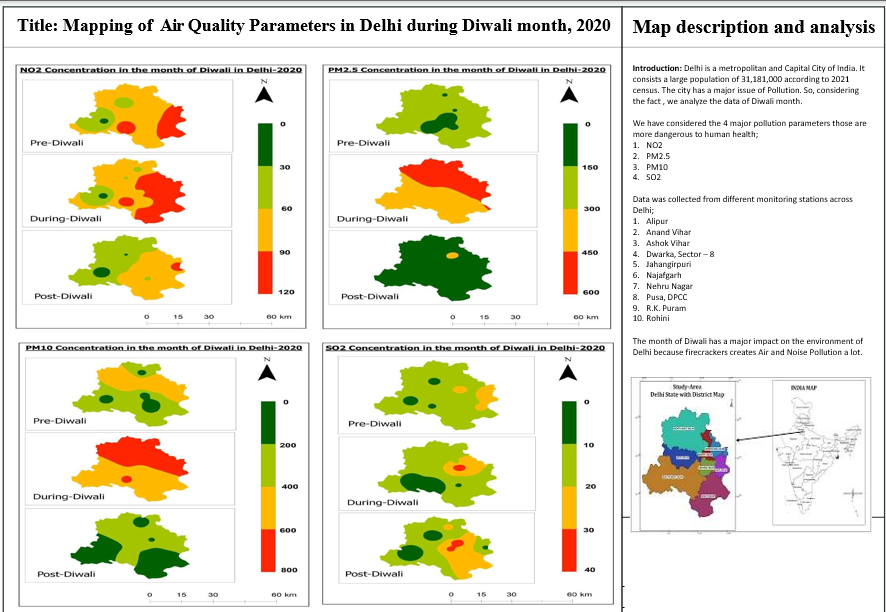
Analyzed the spatial distribution of major air pollutants, including PM₂.₅, PM₁₀, NO₂, and SO₂, across Delhi during the Diwali period. The project used GIS techniques to identify pollution hotspots and visualize variations in air quality across monitoring stations.
ArcMap Excel Interpolation
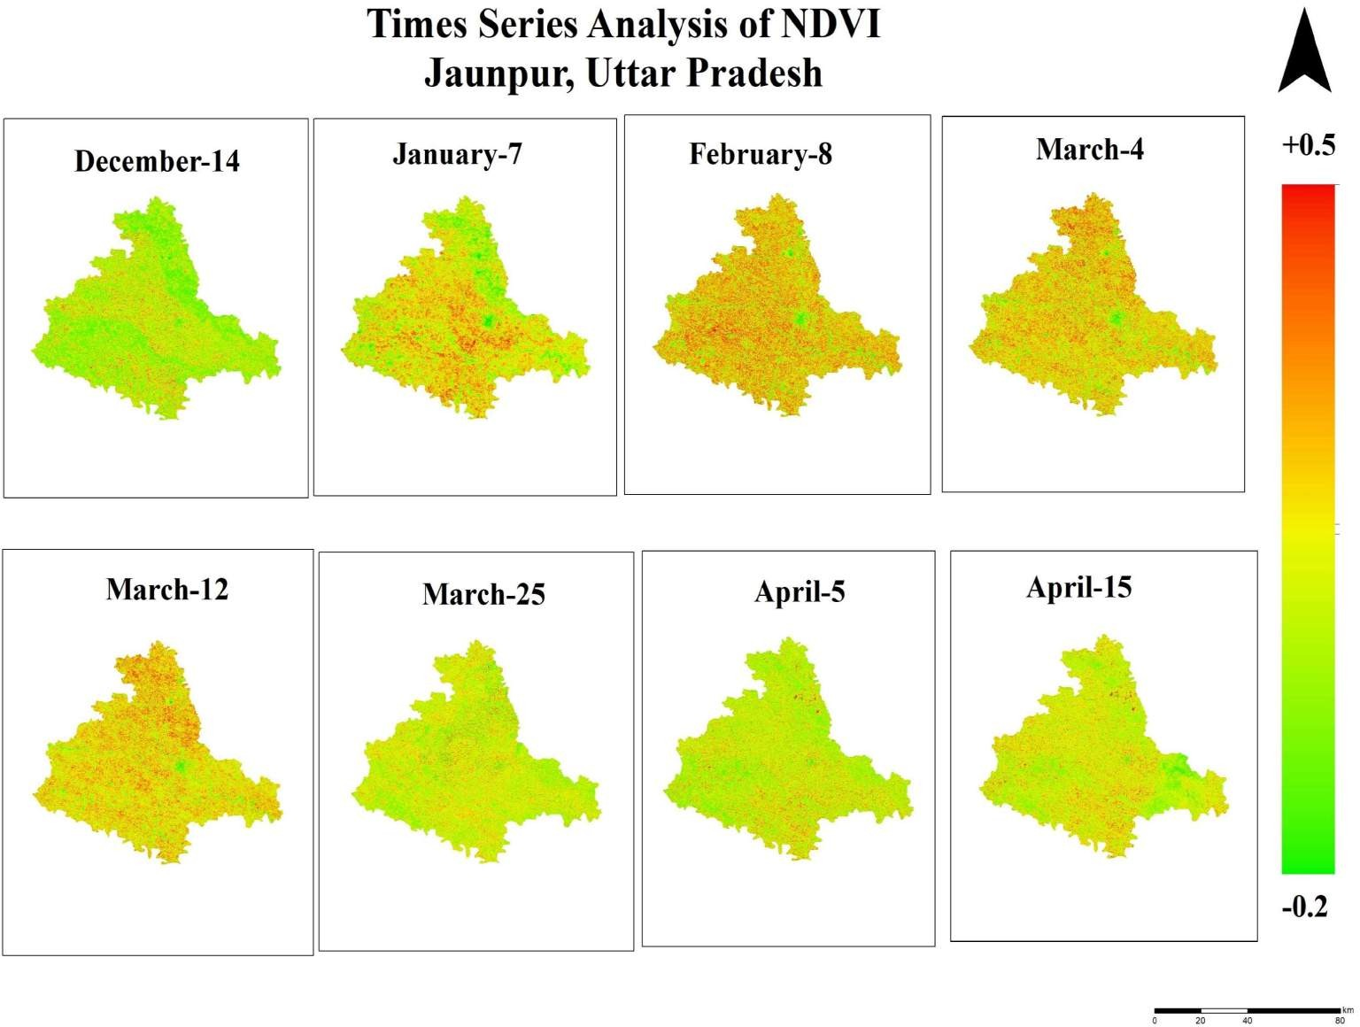
Performed temporal analysis of NDVI to monitor seasonal vegetation dynamics and assess crop growth patterns in Jaunpur district. Time-series satellite imagery was used to evaluate changes in vegetation health throughout the agricultural season.
ArcMap Google Earth Engine Excel Crop Phenology
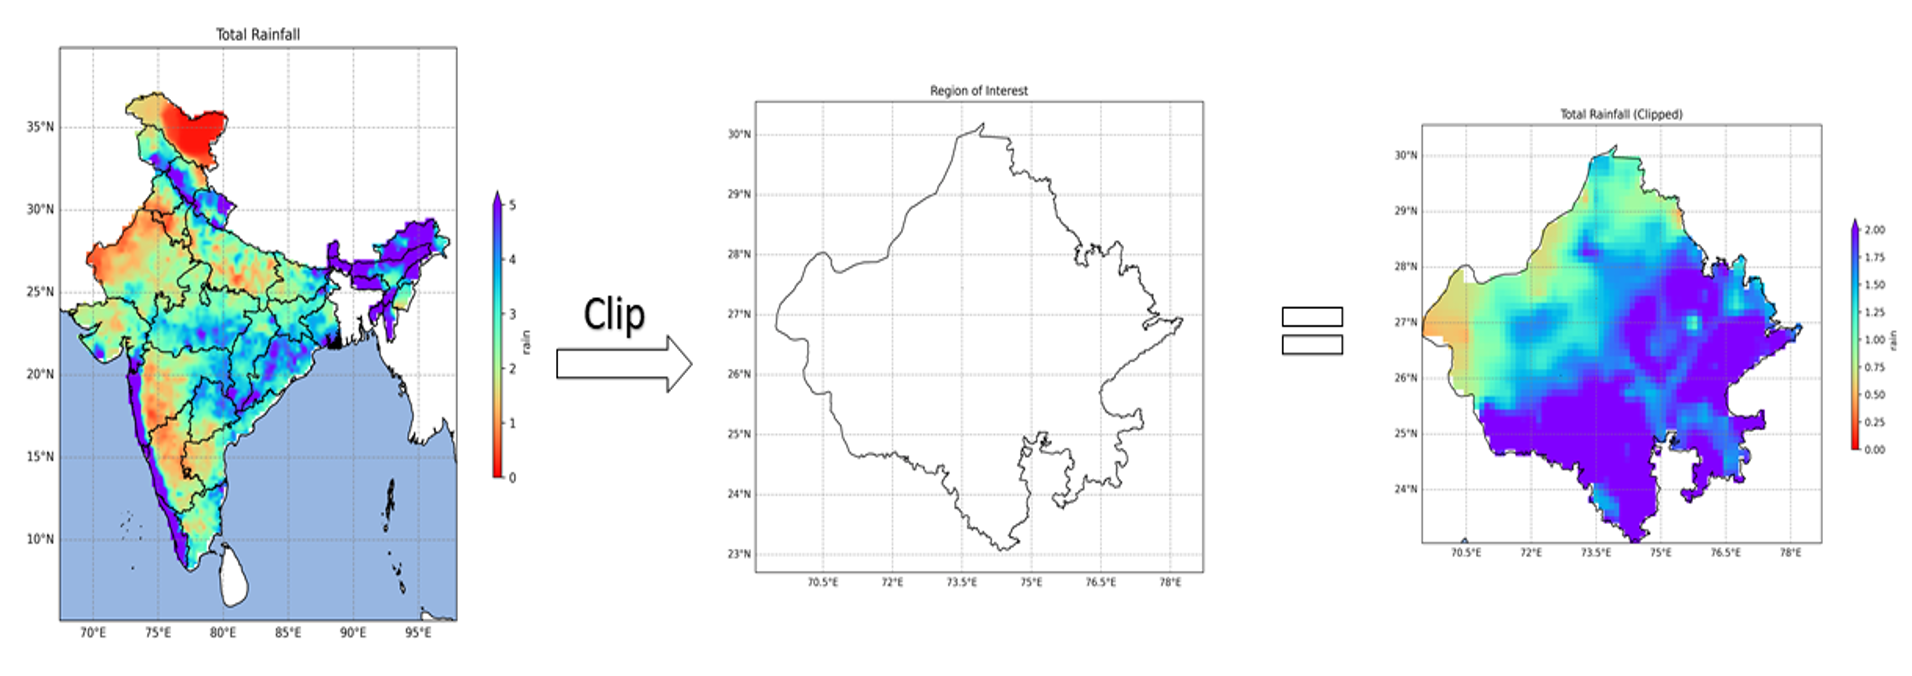
Clipping and Visualizing NetCDF Data Using Python
Developed a Python workflow to clip large NetCDF datasets using administrative boundaries and generate spatial visualizations for the region of interest. The workflow improved processing efficiency and simplified climate data analysis
IMDlib xarray Geopandas dask
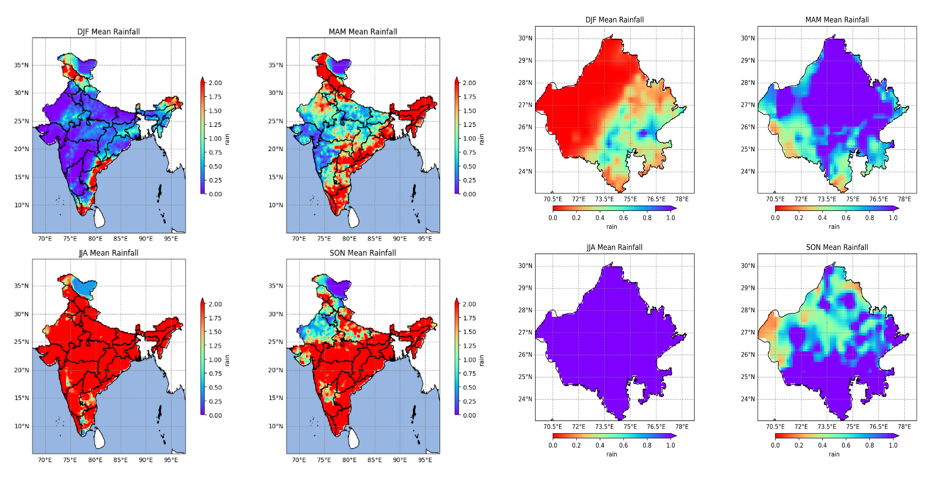
Seasonal Average Rainfall Visualization
Processed long-term climate datasets to calculate seasonal average rainfall and visualize spatial rainfall variability using Python. The resulting maps provide insights into seasonal precipitation patterns and support climate-related studies.
NetCDF cartopy matplotlib time series
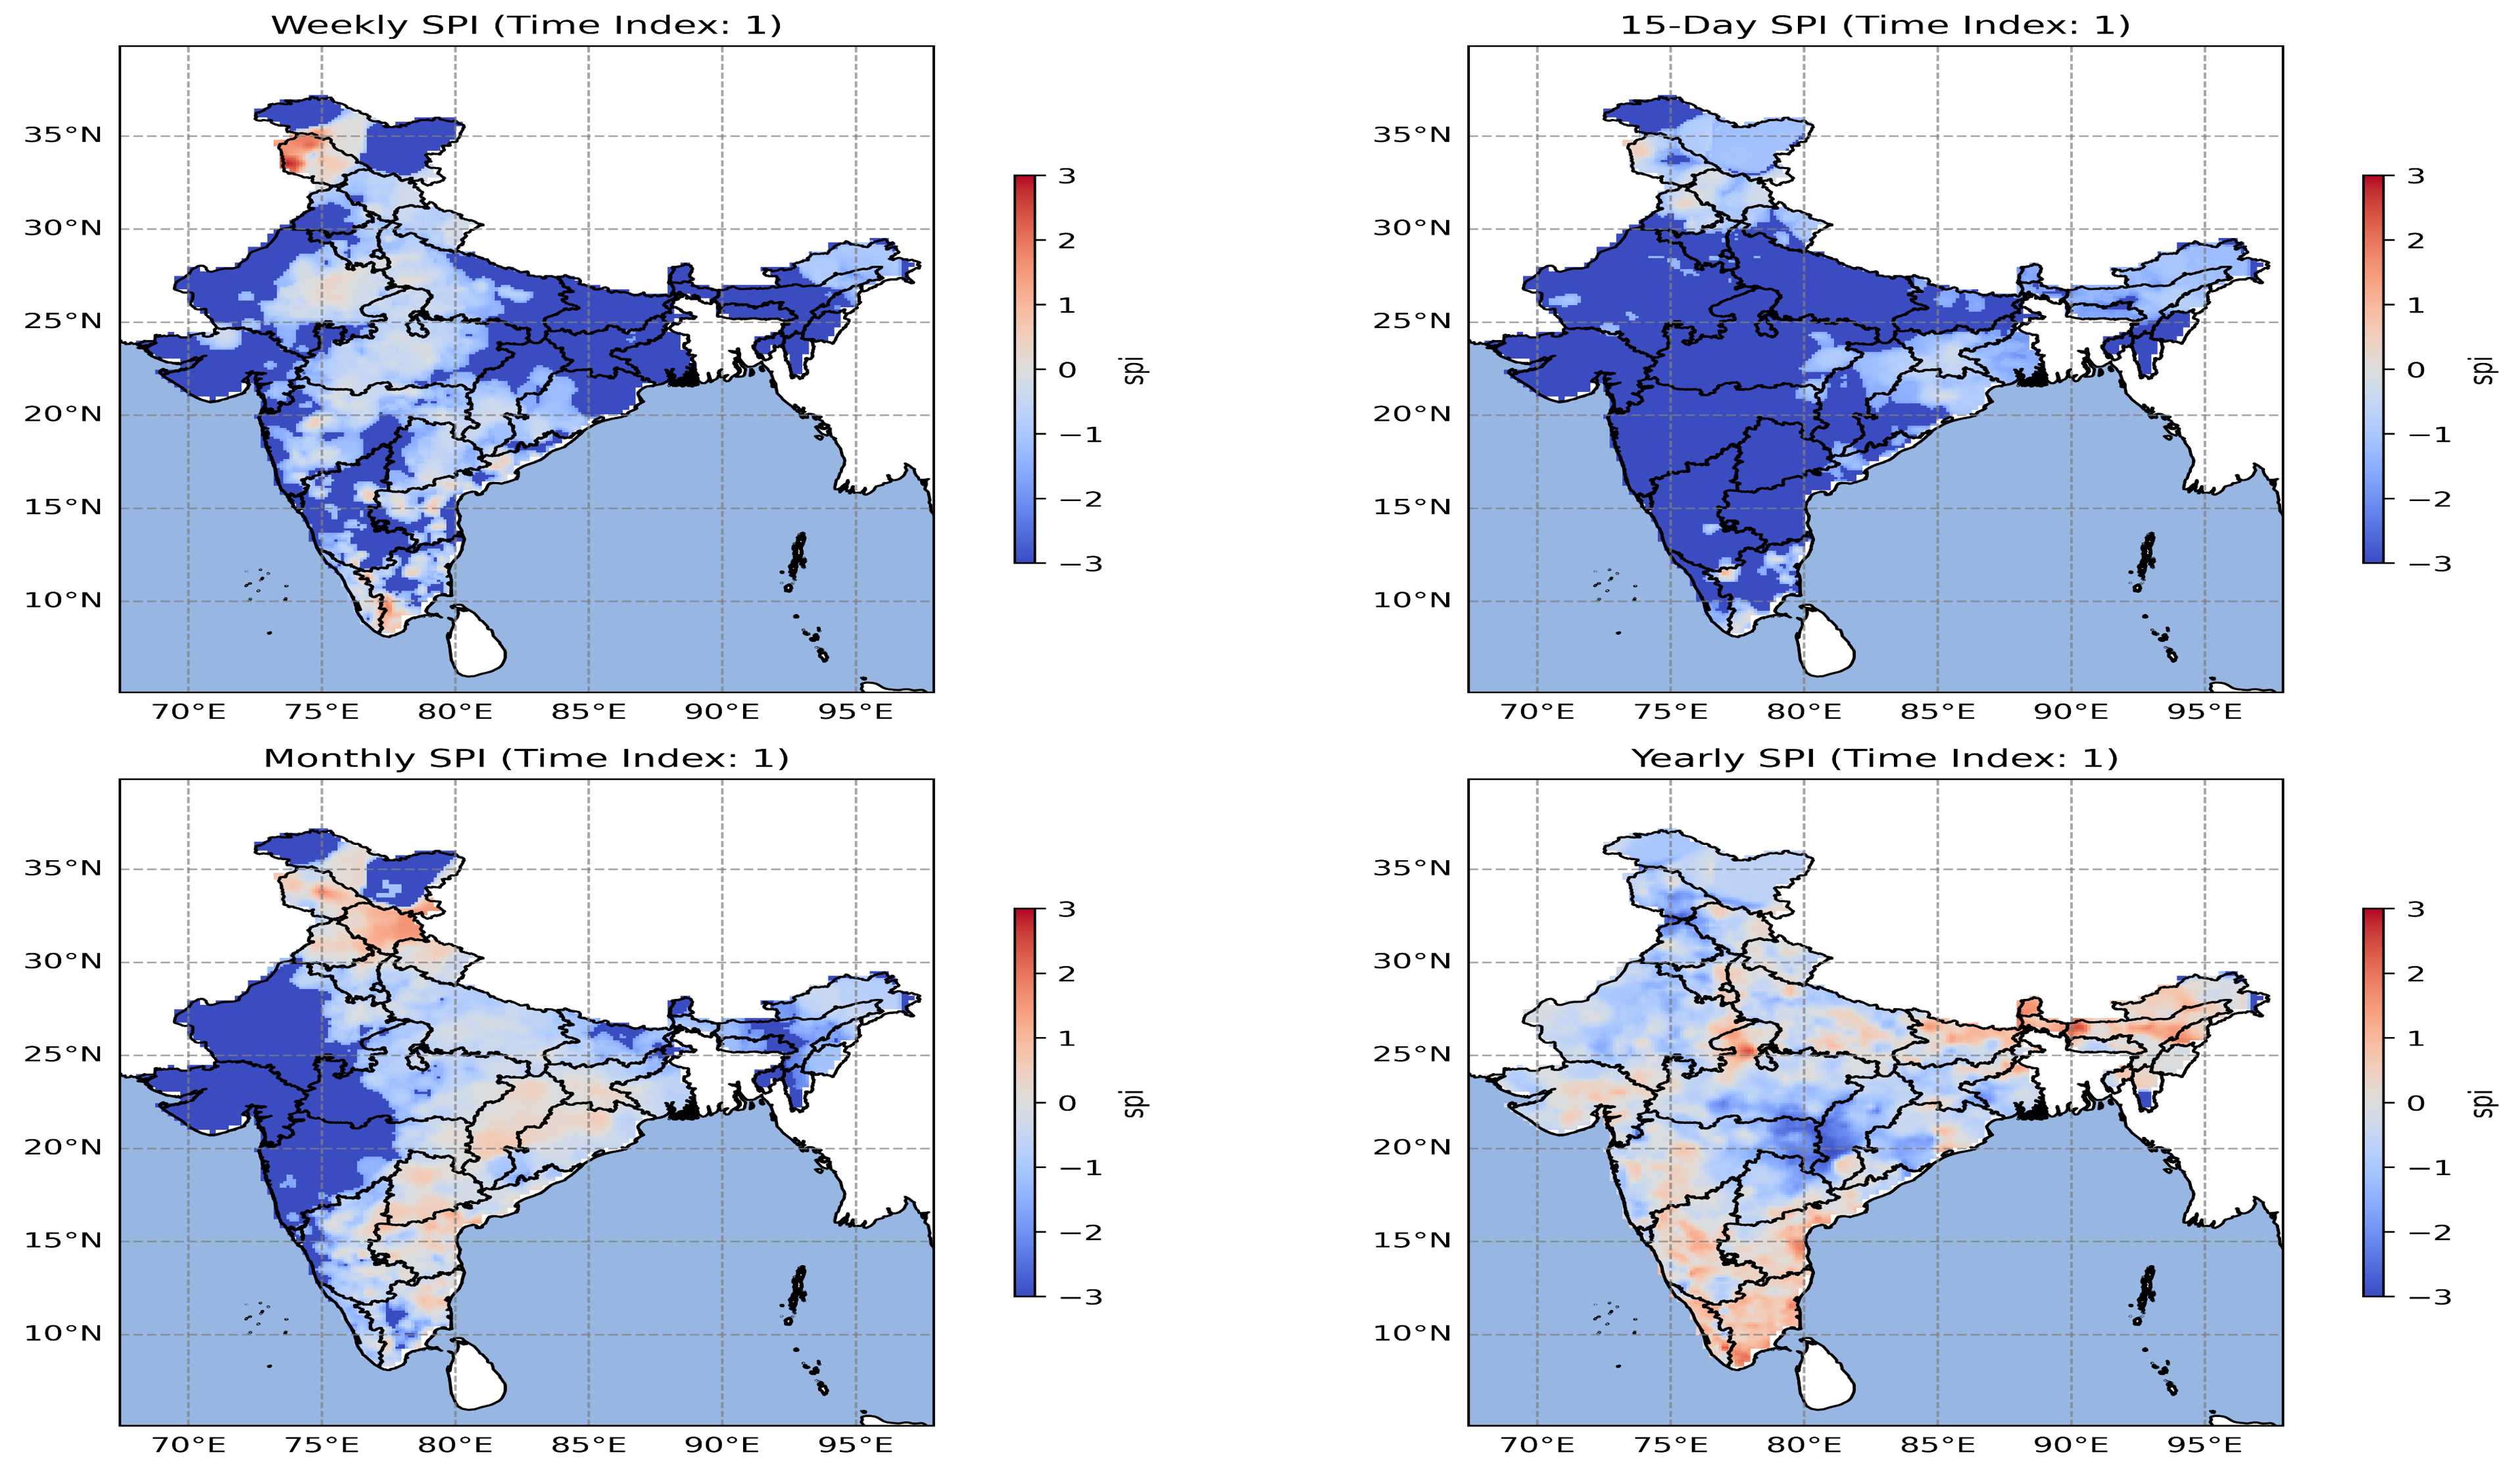
Standardized Precipitation Index (SPI) Analysis
Developed a Python-based workflow to calculate the Standardized Precipitation Index (SPI) from historical precipitation data for drought assessment. The project identified wet and dry conditions across multiple time scales to support climate monitoring and water resource planning.
Drought Rainfall Time Series
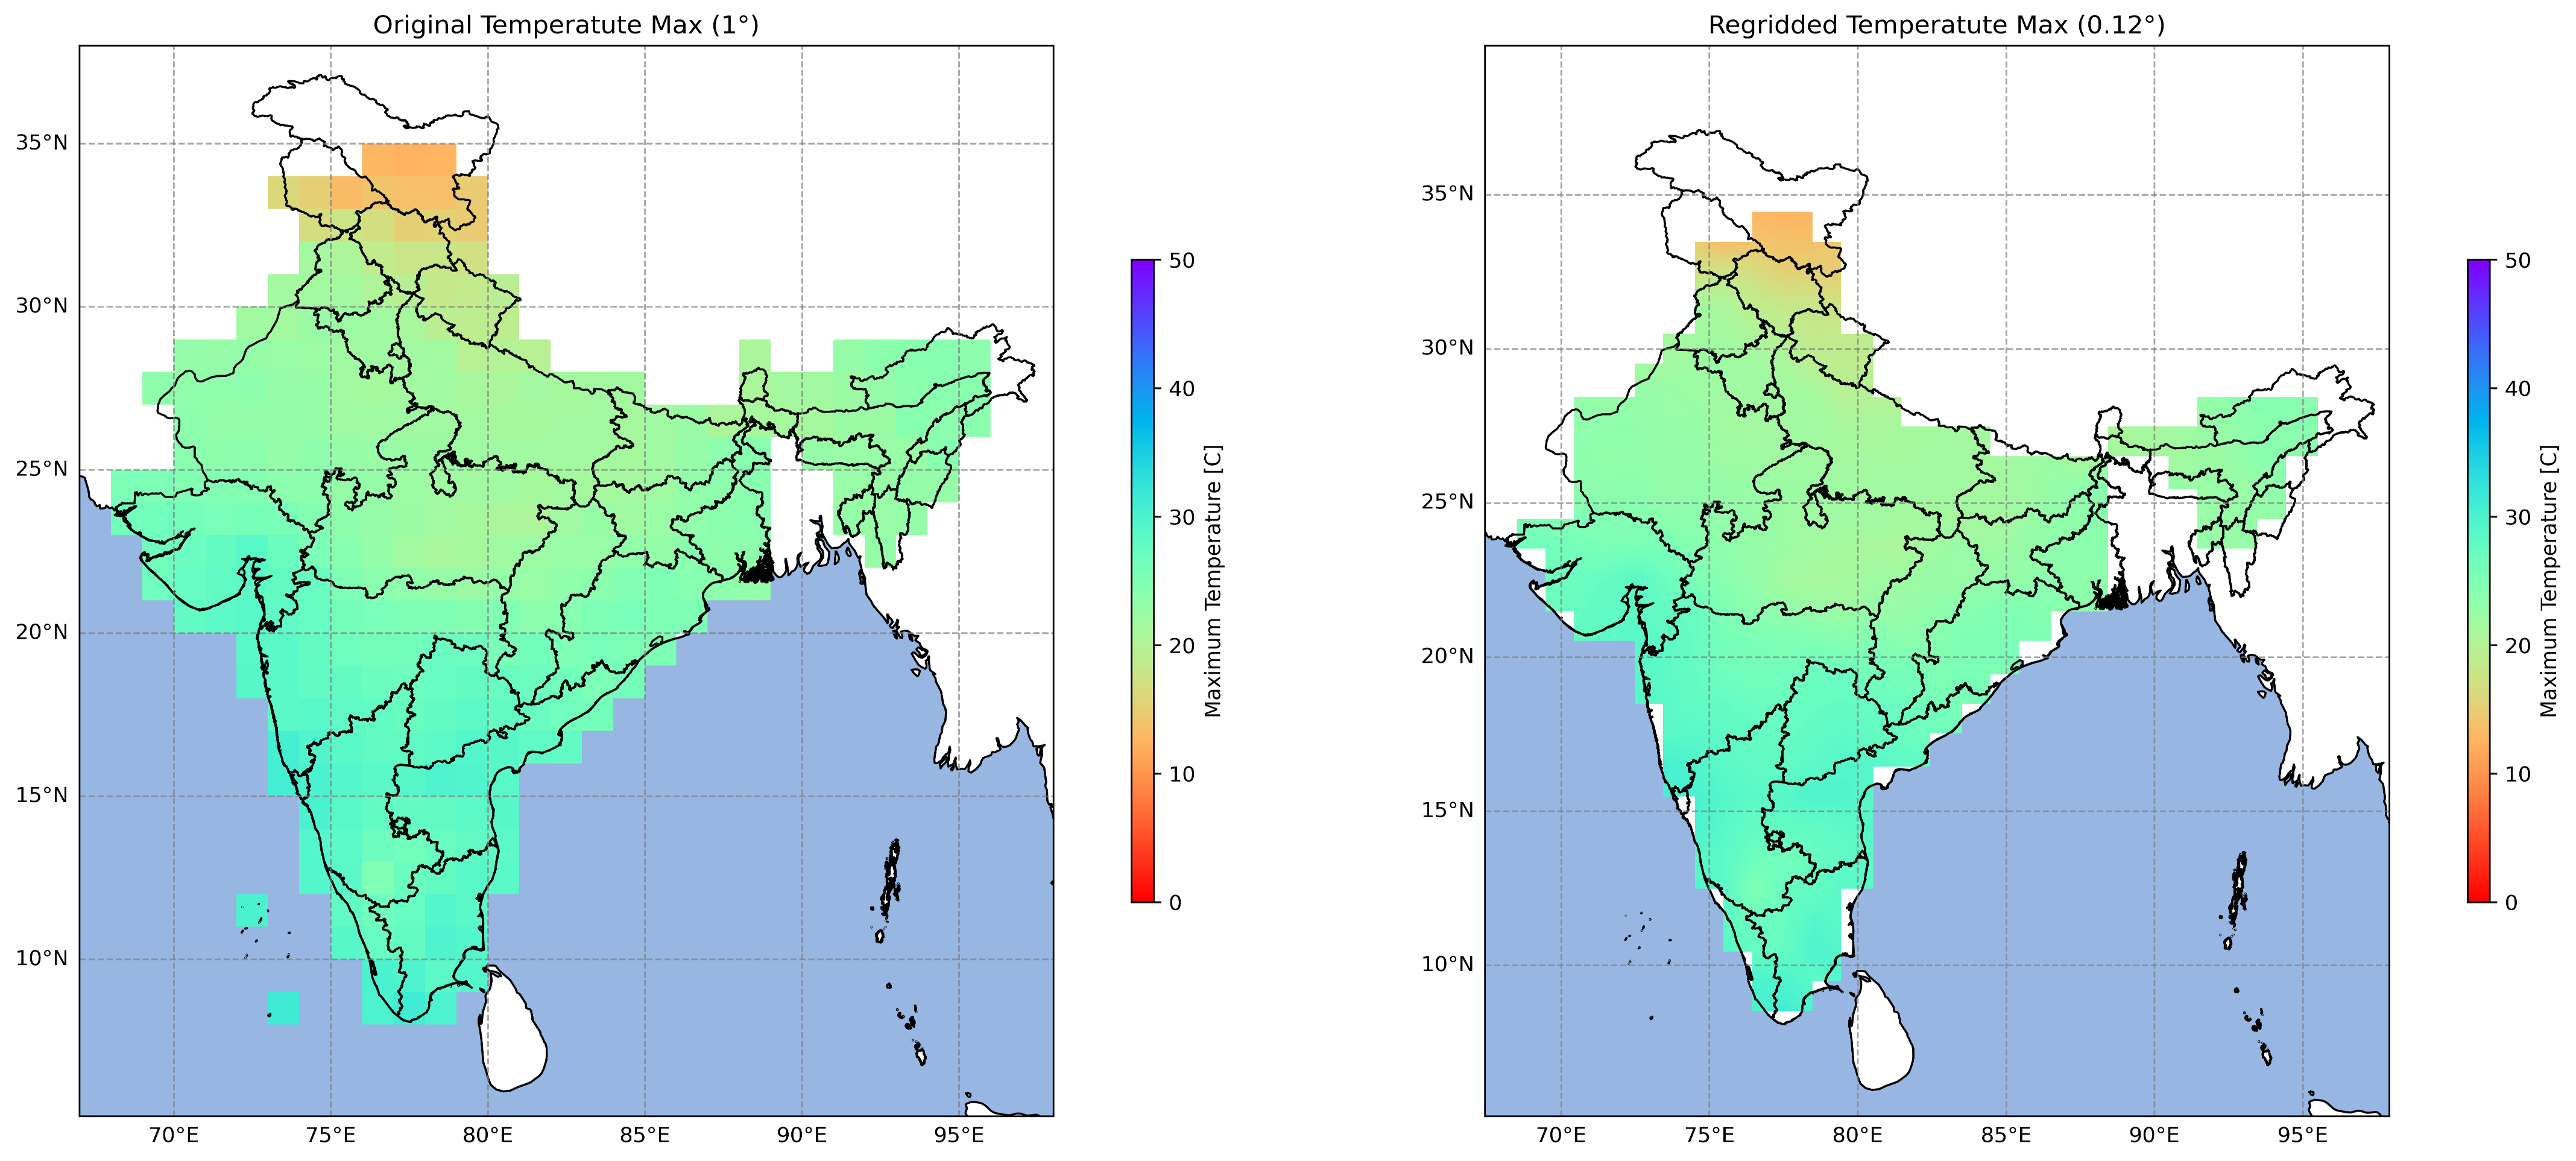
Regridding IMD Temperature Data Using Python
Implemented a spatial regridding workflow to convert coarse-resolution IMD temperature datasets into finer-resolution grids using Python. The enhanced datasets improve compatibility with regional climate analysis and geospatial modeling.
numpy xarray Interpolation IMD
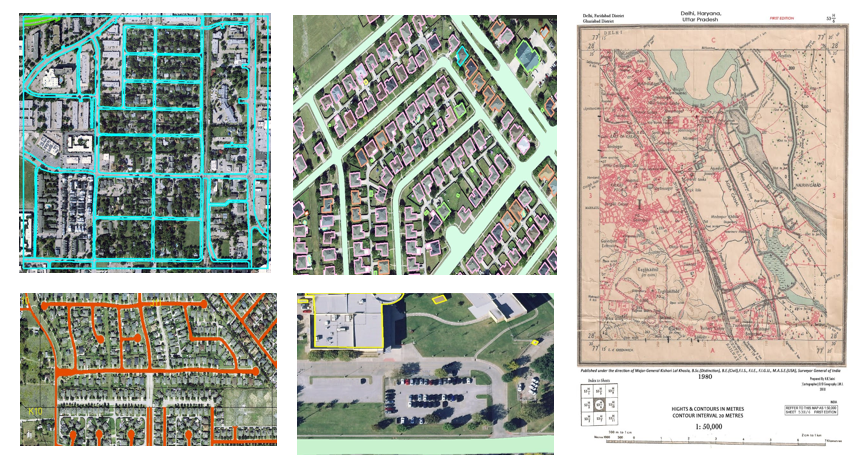
Georeferencing and Digitization
Performed georeferencing of scanned maps using ground control points and digitized key geographic features into vector datasets. The project produced spatially accurate layers suitable for GIS analysis and mapping applications.
Control Points RMS Error Topology Vectorization
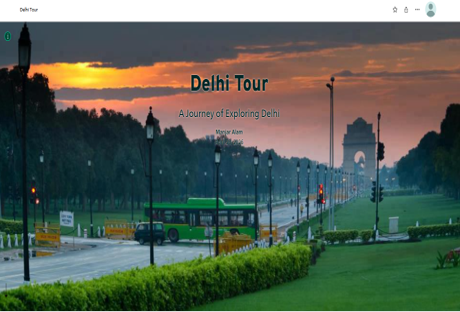
Explore Delhi – ArcGIS StoryMap
Created an interactive StoryMap showcasing important locations, historical landmarks, and geographic information about Delhi using ArcGIS StoryMaps. The project combines maps, multimedia, and narrative content to enhance user engagement.
ArcGIS Online Tourism Heritage
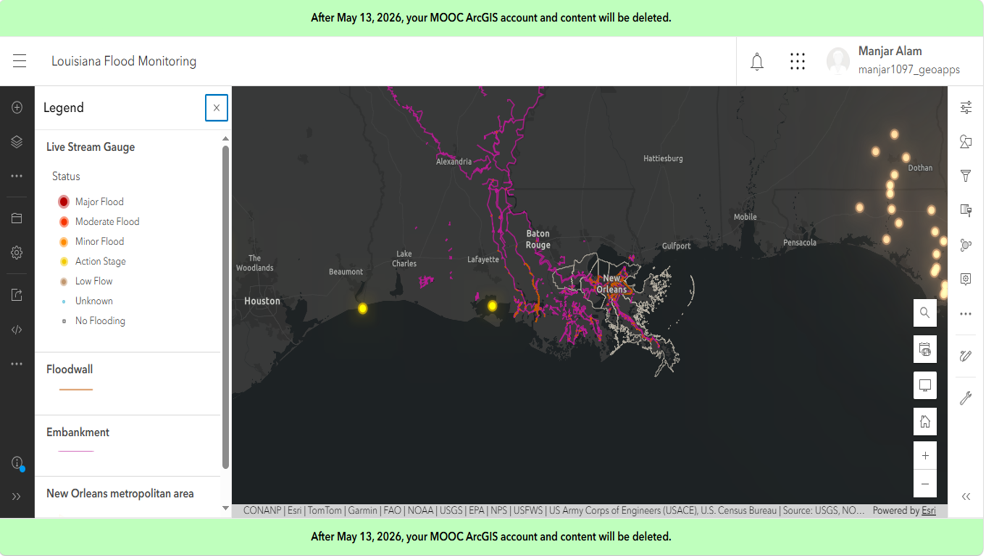
Louisiana Flood Monitoring Dashboard
Designed an ArcGIS Dashboard for monitoring flood conditions through interactive maps and visual indicators. The dashboard provides an intuitive interface for exploring flood-related information and supports situational awareness during flood events.
ArcGIS Online Dashboard Flood
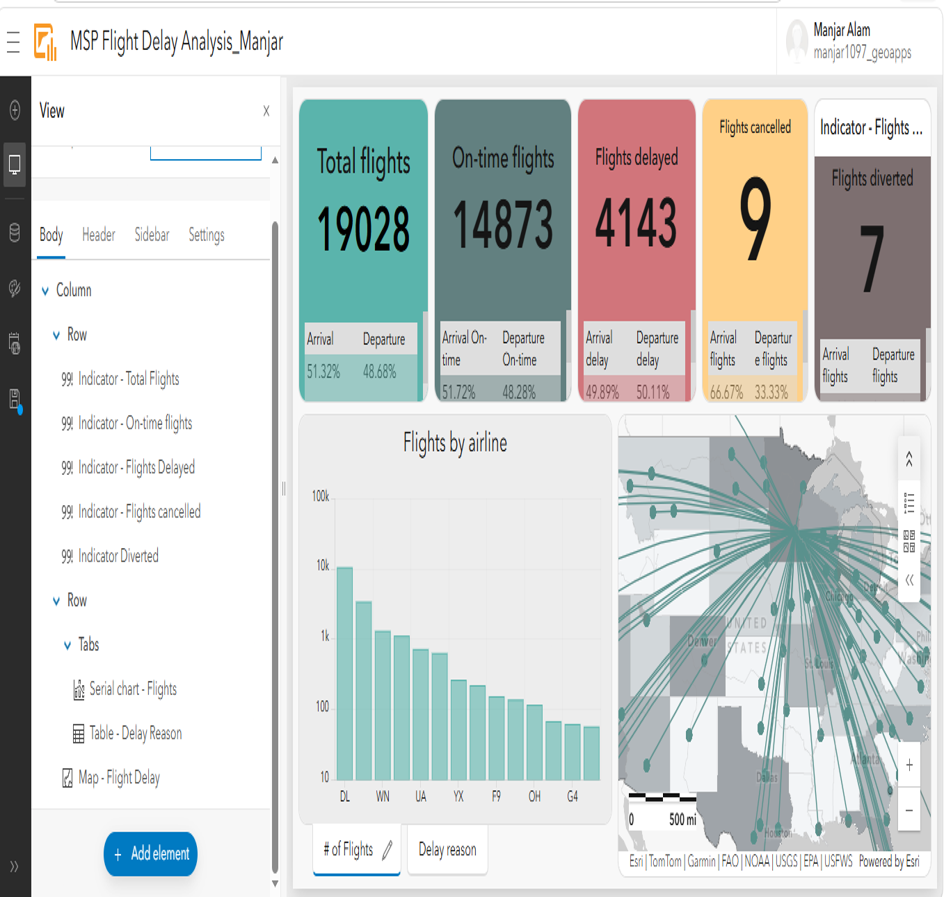
Flight Delay and Cancellation Dashboard
Built an interactive ArcGIS Dashboard to visualize flight delays and cancellations at Minneapolis–Saint Paul International Airport. The dashboard integrates maps, charts, and filters to help users analyze operational performance and travel patterns.
ArcGIS Dashboard Flights
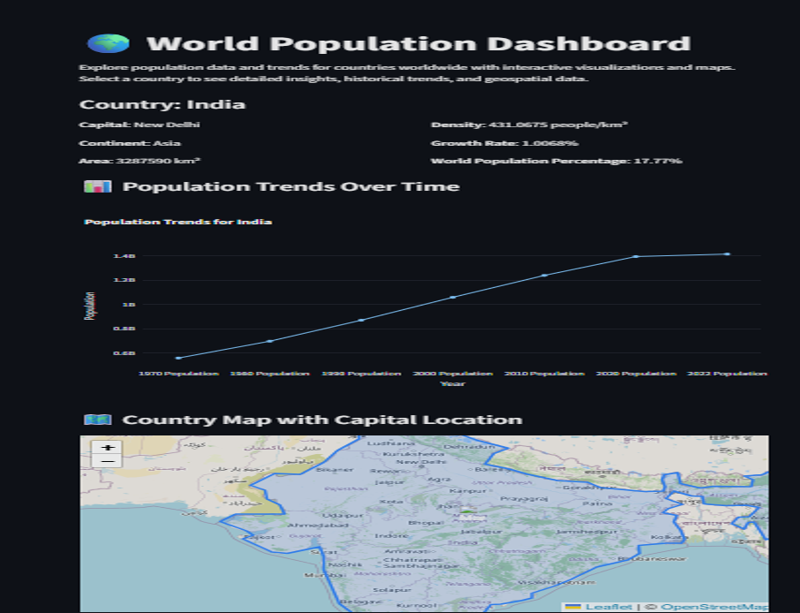
Interactive World Population Dashboard
Developed a Streamlit-based interactive dashboard to visualize and compare population statistics across countries. The application enables users to explore demographic trends through dynamic charts, maps, and user-friendly visualizations.
Streamlit Github Demography GeoJson
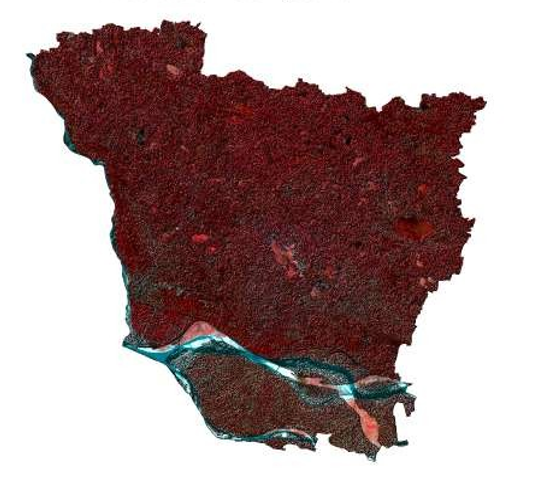
False Color Composite (FCC) Generation
Generated a False Color Composite (FCC) using multispectral satellite imagery to enhance the visualization of vegetation, water bodies, and built-up areas. The FCC improves feature discrimination and serves as a foundation for land cover interpretation and remote sensing analysis.
FCC Sentinel-2
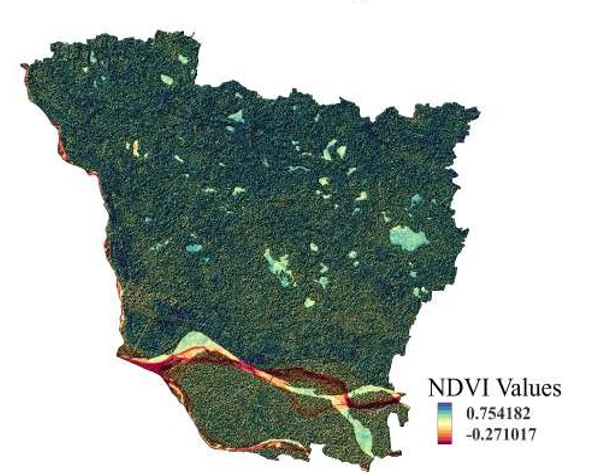
Normalized Difference Vegetation Index (NDVI) Mapping
Computed the Normalized Difference Vegetation Index (NDVI) from satellite imagery to assess vegetation health, density, and spatial distribution across the study area. The resulting map identifies healthy and stressed vegetation, supporting agricultural monitoring and environmental assessment.
Crop Vegetation
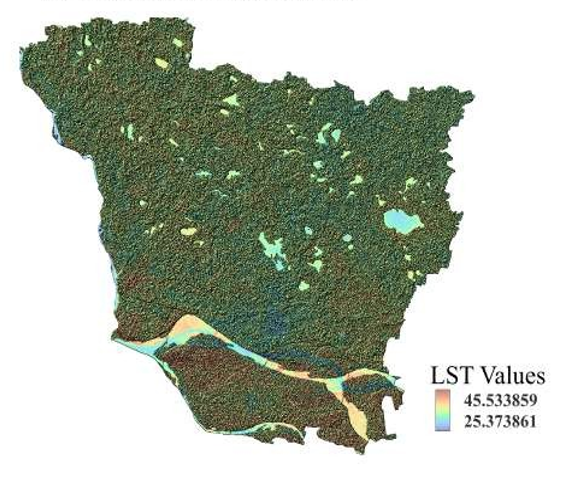
Land Surface Temperature (LST) Mapping
Derived Land Surface Temperature (LST) from thermal satellite imagery to analyze the spatial variation of surface temperatures within the study area. The map helps identify temperature hotspots and supports studies related to urban heat islands, climate monitoring, and environmental.
Temperature Urban Heat Islands Climate
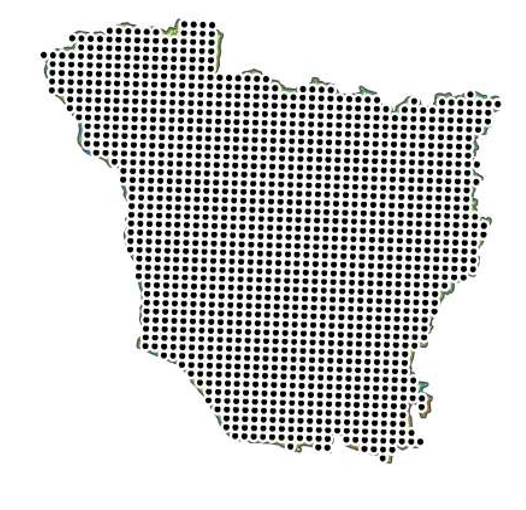
Spatial Sampling Grid Generation
Created a systematic spatial sampling grid to generate uniformly distributed sample points across the study area for geospatial analysis and field data collection. The sampling framework ensures consistent spatial coverage and supports statistical, environmental, and remote sensing studies.
Points Spatial Grids
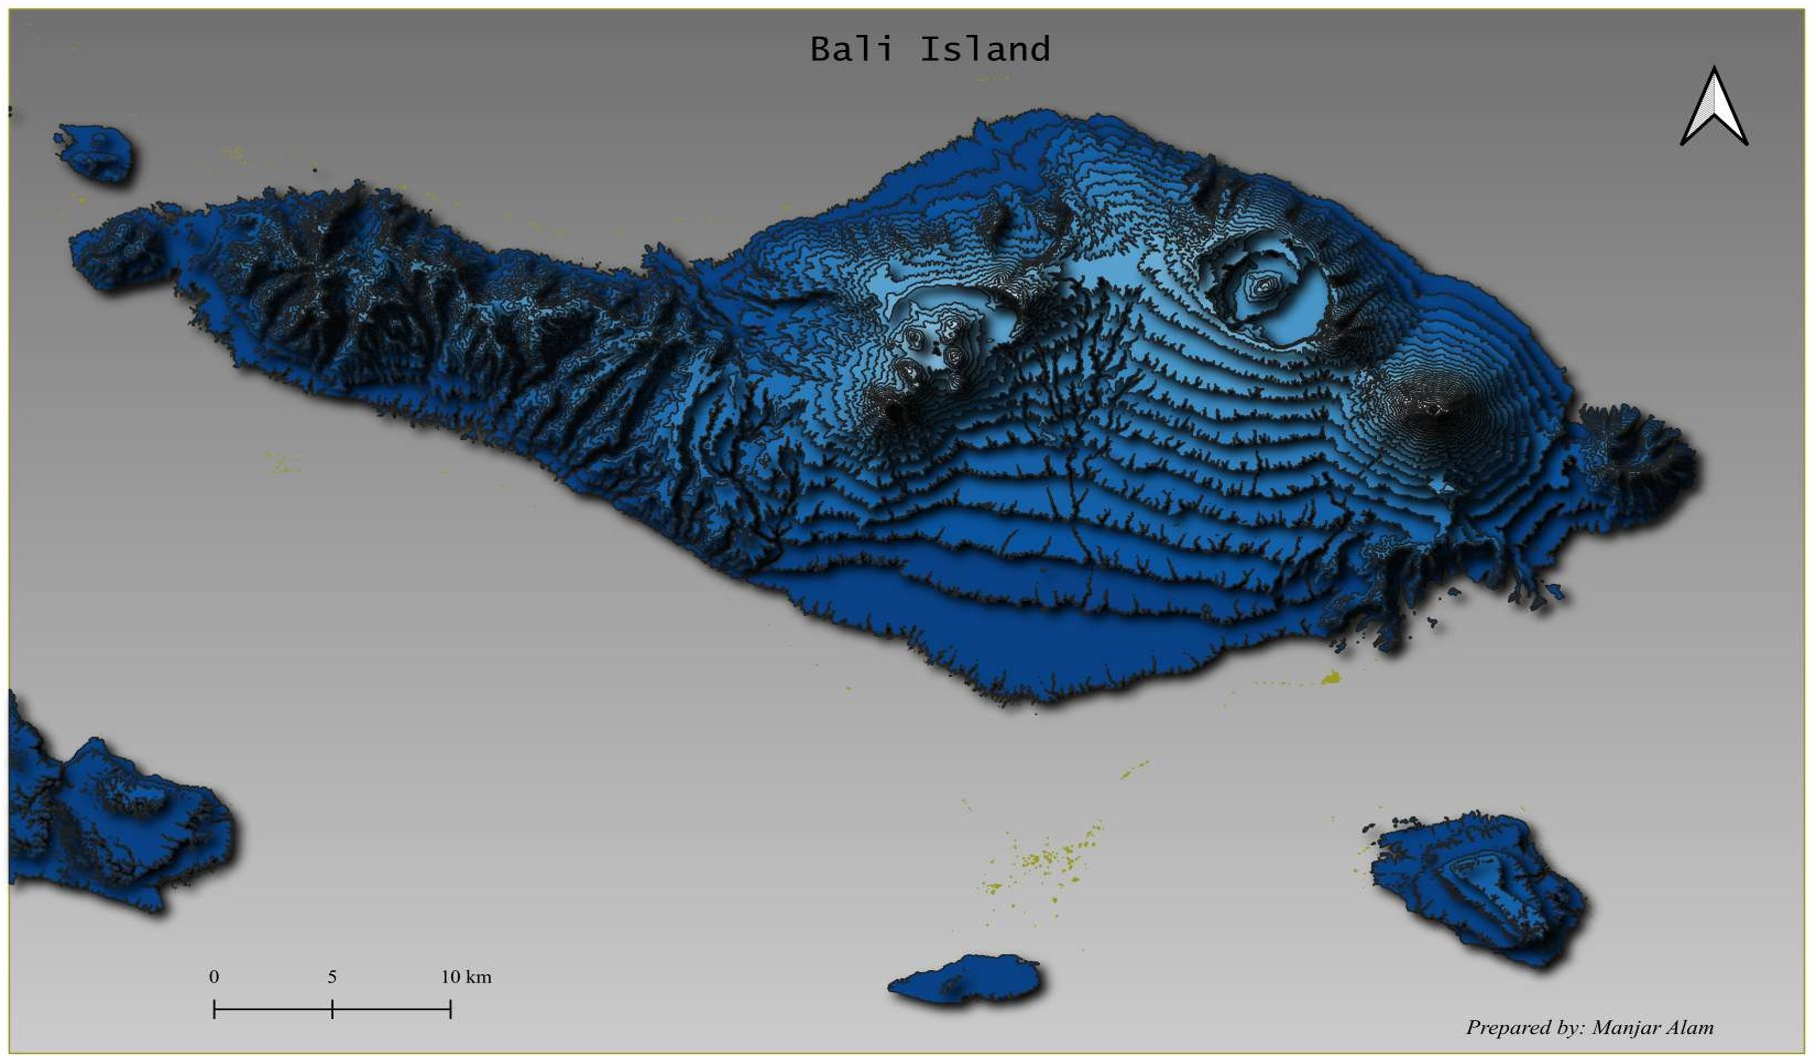
Terrain Visualization Using SRTM DEM
Developed a high-resolution terrain visualization of Bali Island using SRTM Digital Elevation Model (DEM) data in QGIS. The map highlights elevation variations, landforms, and topographic features through hillshade and contour visualization, providing valuable insights for terrain analysis and environmental planning.
QGIS SRTM 3D
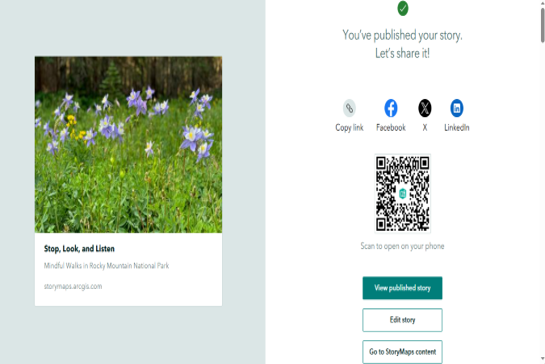
Mindful Walks in Rocky Mountain National Park
Developed an interactive ArcGIS StoryMap showcasing scenic trails, natural landscapes, and key points of interest within Rocky Mountain National Park. The project combines maps, multimedia, and narrative content to create an engaging digital storytelling experience that enhances visitor exploration and geographic understanding.
ArcGIS StoryMaps ArcGIS Online