Clipping and Visualizing NetCDF Data Using Python
Overview
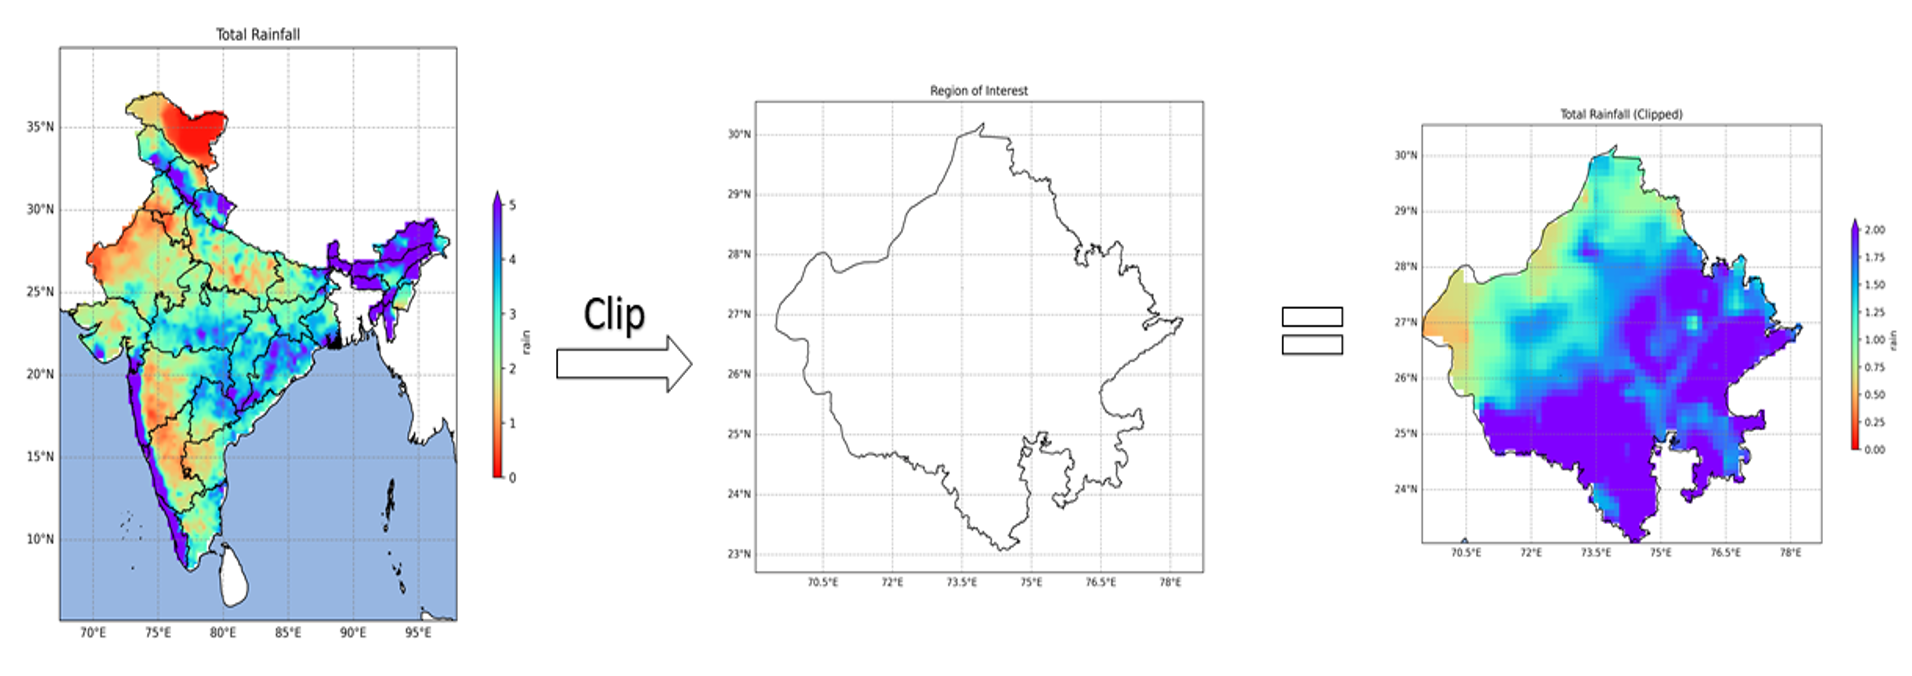
Developed a Python workflow to clip large NetCDF datasets using administrative boundaries and generate spatial visualizations for the region of interest. The workflow improved processing efficiency and simplified climate data analysis
Study Area: Rajasthan, India
Duration: Personal Learning Project (2026)
Role: Solo project
Status: Completed
Methods & Tools
Data Sources
- IMD Pune
- Administrative Boundary Shapefile
Tools Used
- Python
- Xarray
- Rioxarray
- GeoPandas
- Matplotlib
Key Findings
- Automated clipping of large NetCDF datasets.
- Improved processing efficiency.
- Generated publication-quality climate maps.