Delhi Air Quality Mapping
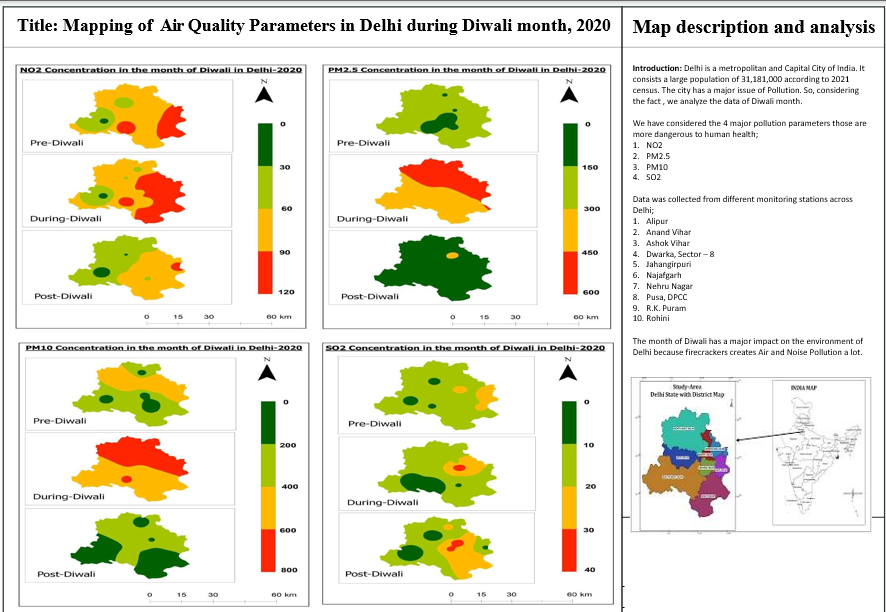
Overview
Analyzed the spatial distribution of major air pollutants, including PM₂.₅, PM₁₀, NO₂, and SO₂, across Delhi during the Diwali period. The project used GIS techniques to identify pollution hotspots and visualize variations in air quality across monitoring stations.
Study Area: Delhi
Duration: Personal Learning Project (2026)
Role: Solo project
Status: Completed
Methods & Tools
Data Sources
- CPCB Air Quality Monitoring Stations
- Delhi Administrative Boundary
- OpenStreetMap Basema
Tools Used
- ArcMap
- Microsoft Excel
Key Findings
- Mapped spatial distribution of PM₂.₅, PM₁₀, NO₂, and SO₂.
- Identified pollution hotspots during the Diwali period.
- Compared pollutant concentrations across monitoring stations.